IPDA with Order Blocks [Enhanced]Summary of the Code
This script plots IPDA Standard Deviations on a price chart, helping traders visualize potential support and resistance levels based on a series of user-defined deviations. It uses swing high/low points and time-based fractal lookbacks (monthly, weekly, daily, or intraday) to define price anchors and compute deviation lines.
Key features include:
Deviations: It calculates and plots deviation levels based on the distance between swing highs and lows, which traders can use as price targets or zones of interest.
Timeframes:
Monthly (higher timeframe analysis)
Weekly (medium-term analysis)
Daily and Intraday (shorter-term precision)
Customization:
Choose which deviation levels (e.g., 0, 1, -1, -2) to display.
Hide labels or adjust their sizes for cleaner charts.
Option to remove invalidated deviation levels dynamically.
Visual Cleanliness: Automatically removes clutter by hiding or deleting invalid deviation levels and focusing on active price zones.
How to Utilize It for Intraday Trading to Make $1,000
Here’s how to effectively use the indicator to optimize intraday trading:
1. Set the Right Timeframe:
Use the 15-minute or 1-hour chart for intraday setups.
Ensure the "Intraday" lookback option is enabled to focus on shorter-term swings.
2. Interpret the Levels:
Bearish Order Blocks: Look for red lines (bearish deviation) as potential resistance zones where the price may reverse downward.
Bullish Order Blocks: Look for green lines (bullish deviation) as potential support zones where the price may bounce upward.
3. Plan Entries and Exits:
Entry: Buy near a green order block or short near a red order block, confirming the trade with additional signals (e.g., candlestick patterns, momentum indicators).
Stop Loss: Place your stop below the green line (for buys) or above the red line (for shorts).
Profit Targets: Use deviation levels as targets (e.g., from the 0 level to +1 or -1).
4. Combine with Market Context:
Use the script alongside volume profile, trend indicators, or news events for confirmation.
Avoid trading during major news events unless aligned with deviations.
5. Position Sizing for $1,000 Goal:
Trade liquid instruments like Nasdaq futures (NQ) or major forex pairs.
Risk 1-2% of your capital on each trade and scale into positions if confirmed.
Target a profit of 10-20 points per trade on Nasdaq futures, with 1-2 trades daily.
6. Monitor Key Timeframes:
Pre-market (before 9:30 AM EST): Mark deviation levels to predict market open behavior.
Midday & Power Hour (3-4 PM EST): Watch for breakouts or retests around key deviation levels.
By combining this tool with disciplined risk management and a clear trading plan, you can systematically work toward your profit target while minimizing unnecessary risks
Search in scripts for "order block"

Smart Money Setup 01 [TradingFinder]Double Order Blocks Proof🔵 Introduction
The Price Action, styled as the "Smart Money Concept" or "SMC," was introduced by Mr. David J. Crouch in 2000 and is one of the most modern technical styles in the financial world. In financial markets, Smart Money refers to capital controlled by major market players (central banks, funds, etc.), and these traders can accurately predict market trends and achieve the highest profits.
In the "Smart Money" style, various types of "order blocks" can be traded. This indicator uses a type of "order block" originating from "BoS" (Breakout of Structure). The most important feature of this indicator is the confirmation of two order blocks.
🟣 Important
For example, after the first "BoS" and the formation of the first Order Block, if a second "BoS" occurs before touching the price of the first Order Block and the formation of the second Order Block, a trading setup with 2 order blocks is formed, which confirms the dominant market trend.
For a better understanding of this subject, see the explanations in the following two images.
Bullish Setup Details :
Bearish Setup Details :
🔵 How to Use
After adding the indicator to the chart, you should wait for the formation of the trading setup. You can observe different trading positions by changing the "Time Frame" and "Pivot Period." Generally, the higher the "Time Frame" and "Pivot Period," the more valid the formed setup is.
Bullish Setup Details on Chart :
Bearish Setup Details on Chart :
You can access the "Pivot Period" input through the settings.

Whale Breaker — HTF Order Blocks + Market Structure HUDWhale Breaker (Debug Edition) is an advanced Smart Money Concept (SMC) tool designed to project High Timeframe (HTF) order blocks onto your Lower Timeframe (LTF) charts while tracking market structure breaks (BOS / CHoCH).
This debug build adds extra transparency: the mini-HUD not only shows HTF trend, last signal, and active order blocks, but also explains why no new block was created (e.g. no HTF BOS, body not found, ATR filter too strict, max-per-side limit). This makes it easier to fine-tune your settings and understand the logic behind the indicator.
Key features:
- HTF order blocks (e.g. 1h) projected into LTF charts (e.g. 15m)
- Automatic right-extension until mitigation (MB)
- Mitigation detection: blocks shaded once filled
- ATR filter to remove insignificant micro-zones
- Per-side cap: limit the maximum active BU/B blocks
- Lookback-based pruning for clean charts
- BOS/CHoCH arrows on chart (▲ green = bullish, ▼ red = bearish)
- Compact HUD with trend, last signal, active OBs, legend, and debug reasons
Usage:
- Define your HTF (e.g. 1h) and trade entries on the LTF (e.g. 15m).
- Wait for a BOS in HTF direction, then target the projected order block.
- Stop Loss just beyond the OB, Take Profit at next opposite OB or using a fixed RRR.
Note: This is a debugging/educational version to understand order block creation logic.
For live trading, consider using the standard Whale Breaker.

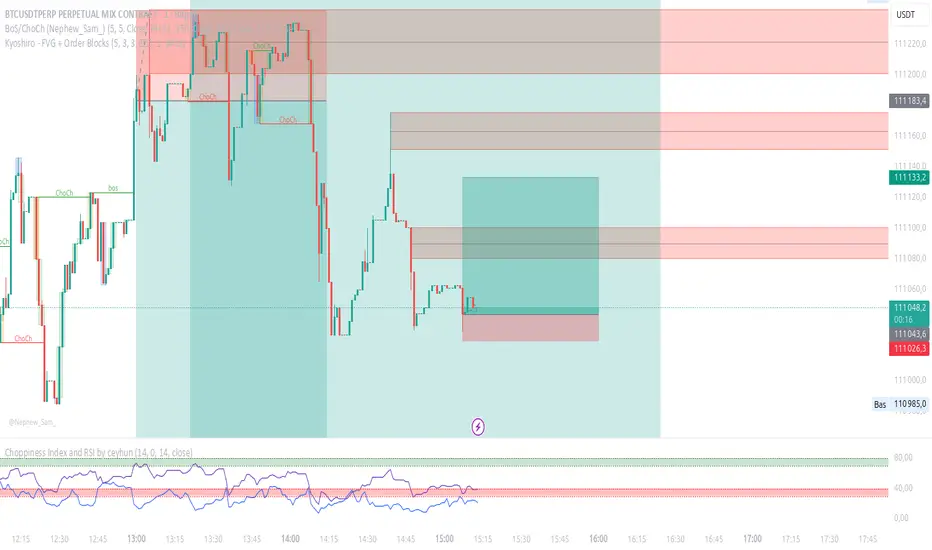
Kyoshiro - FVG + Order Blocks📌 Kyoshiro – FVG + Order Blocks
This indicator combines Order Block (OB) detection with an intelligent auto-management system and a clean visual display on the chart.
It is designed to help traders better identify institutional zones where price frequently reacts.
⚙️ Key Features:
✅ Real-time detection of bullish and bearish Order Blocks.
✅ Automatic cleanup: invalidated OBs are removed to keep the chart clean.
✅ Customizable display:
Maximum number of visible OBs (bullish / bearish).
Zone colors, outlines, and midlines.
Line styles (solid, dashed, dotted) and adjustable width.
✅ Choice of mitigation method:
Wick
Close
✅ Built-in alerts:
Formation of bullish or bearish OB.
Mitigation of an existing OB.
🔔 Available Alerts:
Bullish OB Formed → A bullish order block is detected.
Bearish OB Formed → A bearish order block is detected.
Bullish OB Mitigated → A bullish OB has been invalidated.
Bearish OB Mitigated → A bearish OB has been invalidated.
🎯 Use Cases:
Quickly identify key liquidity zones.
Track institutional activity in the market.
Improve entry and exit precision.
Internal Market Structure + Order BlocksInternal Market Structure + Order Blocks
This indicator combines internal market structure shifts with order block detection to help traders identify key zones of institutional interest and potential trend reversals. It highlights bullish and bearish engulfing conditions that mark the formation of valid order blocks, and it plots internal structure shifts—early signals that may precede a larger move.
Key Features:
-Bullish & Bearish Order Blocks: Highlighted with shaded boxes (green for bullish, red for bearish) following engulfing price action.
-Internal Structure Shifts: Small black triangles show early signs of a potential reversal, offering a unique perspective beyond standard structure analysis.
-Engulfing Breakouts: Marks when price breaks previous opposing structure, confirming new directional intent.
-Alerts Included: Get notified on key structure breaks and internal shifts to stay ahead of potential setups.
This tool is designed to support price action trading by visually mapping key structural changes and zones of interest directly on your chart. It is not intended to function as a standalone trading strategy , but rather as a supplementary tool to inform your own analysis and discretion.
Note: The arrows, polylines, and colored trendlines shown in the chart example are not generated by the indicator. They have been added manually for illustration purposes to demonstrate how the indicator can be used to trace market structure. Likewise, the order blocks in the example are manually drawn and may differ slightly from the indicator's automatic calculations, serving only to enhance visual clarity.

🎯 Wyckoff Order Block Entry System🎯 Wyckoff Order Block Entry System
📝 INDICATOR DESCRIPTION
🎯 Wyckoff Order Block Entry System Short Description:
Professional institutional zone trading combined with Wyckoff methodology. Identifies high-probability entries where smart money meets classic price action patterns.
Full Description:
Wyckoff Order Block Entry System is a precision trading tool that combines two powerful concepts:
Order Blocks - Institutional zones where large players place their orders
Wyckoff Method - Classic price action patterns revealing smart money behavior
🎯 What Makes This Different?
Unlike traditional indicators that flood your chart with signals, this system only triggers entries when BOTH conditions are met:
Price enters an institutional Order Block zone (current timeframe OR higher timeframe)
A Wyckoff pattern occurs (Spring, SOS, Upthrust, or SOW)
This dual-confirmation approach ensures you're trading with institutional flow at optimal entry points.
📊 Key Features:
✅ Order Block Detection
Automatically identifies institutional buying/selling zones
Current timeframe order blocks (solid lines)
Higher timeframe order blocks (dashed lines) for stronger zones
Customizable strength and extension settings
✅ 4 Wyckoff Entry Patterns
SPRING (Bullish Reversal): Fake breakdown below support → Quick recovery
SOS (Sign of Strength): Strong bullish candle after accumulation
UPTHRUST (Bearish Reversal): Fake breakout above resistance → Quick rejection
SOW (Sign of Weakness): Strong bearish candle after distribution
✅ Clean Visual Design
Minimalist approach - only essential information
Color-coded zones (Green = Bullish, Red = Bearish, Cyan/Magenta = HTF)
Clear entry signals with pattern type labels
No chart clutter - focus on what matters
✅ Multi-Timeframe Analysis
Integrates higher timeframe order blocks
HTF signals marked with "+HTF" tag for extra confidence
Fully customizable HTF selection (H1, H4, Daily, etc.)
✅ Smart Alerts
Entry signal alerts (Long/Short)
Order block formation alerts
HTF order block alerts
Customizable alert messages
💡 How To Use:
Setup: Add indicator to your chart, configure HTF timeframe (default H1)
Wait: Let order blocks form (green/red boxes appear)
Watch: Price returns to order block zone
Entry: Signal appears when Wyckoff pattern confirms
Trade: Enter with the signal, stop below/above order block
📈 Best For:
Forex pairs (all majors and crosses)
Gold (XAUUSD)
Crypto (BTC, ETH, etc.)
Indices (SPX, NAS100, etc.)
Stocks
Commodities
⏱️ Recommended Timeframes:
M15 for scalping
M30 for day trading
H1 for swing trading
H4 for position trading
🎯 Win Rate Expectations:
Current TF signals: 60-70%
HTF signals (+HTF tag): 70-80%
Spring/Upthrust patterns: Highest probability
Works on ALL liquid markets
⚙️ Customizable Settings:
Order block detection parameters
HTF timeframe selection
Wyckoff sensitivity (swing length, volume threshold)
Zone extension duration
Color schemes
📚 Trading Strategy:
This indicator works best when:
Trading in the direction of higher timeframe trend
Using proper risk management (1-2% per trade)
Placing stops just outside order block zones
Taking profits at opposite order blocks
Focusing on HTF signals for higher quality
🔒 Risk Management:
Always use stop losses! Recommended placement:
LONG: 10-20 pips below order block
SHORT: 10-20 pips above order block
Target: Minimum 1:2 risk/reward ratio
💎 Why Traders Love This System:
"Finally, an indicator that doesn't spam my chart with useless signals!" - The quality-over-quantity approach means you only get high-probability setups.
"The HTF order blocks changed my trading!" - Multi-timeframe analysis built-in removes the need for manual higher timeframe checks.
"Wyckoff + Order Blocks = Perfect combination!" - Two proven concepts working together create powerful confluence.
📊 Universal Application:
This system works on ANY liquid market with sufficient volume:
✅ Forex (EUR/USD, GBP/USD, USD/JPY, etc.)
✅ Commodities (Gold, Silver, Oil, etc.)
✅ Indices (S&P 500, NASDAQ, DAX, etc.)
✅ Cryptocurrencies (Bitcoin, Ethereum, etc.)
✅ Stocks (Large cap with good liquidity)
🎓 Educational Value:
Beyond just signals, this indicator teaches you:
How institutional traders think
Where smart money places orders
Classic Wyckoff accumulation/distribution patterns
Multi-timeframe analysis techniques
⚡ Performance:
Lightning-fast calculations
No repainting
Real-time signal generation
Clean code, optimized for speed
🚀 Get Started:
Add to your favorite chart
Adjust HTF timeframe to match your trading style
Wait for high-quality signals
Trade with confidence
Remember: Quality beats quantity. This system prioritizes precision over frequency. You might see 2-5 signals per day on M30 - and that's exactly the point. Each signal is carefully filtered for maximum probability.
Ready to trade like institutions?
👉 Add this indicator to your chart now
👉 Configure your preferred HTF timeframe
👉 Start catching high-probability setups
👉 Trade smarter, not harder
Questions or feedback? Drop a comment below!
Found this useful? Hit that ⭐ button and share with fellow traders!
Happy Trading! 🚀📈

Volume Order Block Scanner [BOSWaves]Volume Order Block Scanner - Dynamic Detection of High-Volume Supply and Demand Zones
Overview
The Volume Order Block Scanner introduces a refined approach to institutional zone mapping, combining volume-weighted order flow, structural displacement, and ATR-based proportionality to identify regions of aggressive participation from large entities.
Unlike static zone mapping or simplistic body-size filters, this framework dynamically evaluates each candle through a multi-layer model of relative volume, candle structure, and volatility context to isolate genuine order block formations while filtering out market noise.
Each identified zone represents a potential institutional footprint, defined by significant volume surges and efficient body-to-ATR relationships that indicate purposeful positioning. Once mapped, each order block is dynamically adjusted for volatility and tracked throughout its lifecycle - from creation to mitigation to potential invalidation - producing an evolving liquidity map that adapts with price.
This adaptive behavior allows traders to visualize where liquidity was absorbed and where it remains unfilled, revealing the structural foundation of institutional intent across timeframes.
Theoretical Foundation
At its core, the Volume Order Block Scanner is built on the interaction between volume displacement and structural imbalance. Traditional order block systems often rely on fixed candle formations or simple engulfing logic, neglecting the fundamental driver of institutional activity: volume concentration relative to volatility.
This framework redefines that approach. Each candle is filtered through two comparative ratios:
Relative Volume Ratio (RVR) - the candle’s volume compared to its rolling average, confirming genuine transactional surges.
Body-ATR Ratio (BAR) - a measure of displacement efficiency relative to recent volatility, ensuring structural strength.
Only when both conditions align is an order block validated, marking a displacement event significant enough to create a lasting imbalance.
By embedding this logic within a volatility-adjusted environment, the system maintains scalability across asset classes and volatility regimes - equally effective in crypto, forex, or index markets.
How It Works
The Volume Order Block Scanner operates through a structured multi-stage process:
Displacement Detection - Identifies candles whose body and volume exceed dynamic thresholds derived from ATR and rolling volume averages. These represent the origin points of institutional aggression.
Zone Construction - Each qualified candle generates an order block with ATR-proportional dimensions to ensure consistency across instruments and timeframes. The zone includes two regions: Body Zone (the precise initiation point of displacement) and Wick Imbalance (the residual inefficiency representing unfilled liquidity).
Lifecycle Tracking - Each zone is continuously monitored for market interaction. Reactions within a defined window are classified as respected, mitigated, or invalidated, giving traders a data-driven sense of ongoing institutional relevance.
Volume Confirmation Layer - Reinforces signal integrity by ensuring that all detected blocks correspond with meaningful increases in transactional activity.
Temporal Decay Control - Zones that remain untested beyond a set period gradually lose visual and analytical weight, maintaining chart clarity and contextual precision.
Interpretation
The Volume Order Block Scanner visualizes how institutional participants interact with the market through zones of accumulation and distribution.
Bullish order blocks denote demand imbalances where price displaced upward under high volume; bearish order blocks signify supply regions formed by concentrated selling pressure.
Price revisiting these areas often reflects institutional re-entry or liquidity rebalancing, offering actionable insights for both continuation and reversal scenarios.
By continuously monitoring interaction and expiry, the framework enables traders to distinguish between active institutional footprints and historical liquidity artifacts.
Strategy Integration
The Volume Order Block Scanner integrates naturally into advanced structural and order-flow methodologies:
Liquidity Mapping : Identify high-volume regions that are likely to influence future price reactions.
Break-of-Structure Confirmation : Validate BOS and CHOCH signals through aligned order block behavior.
Volume Confluence : Combine with BOSWaves volume or momentum indicators to confirm real institutional intent.
Smart-Money Frameworks : Utilize order block retests as precision entry zones within SMC-based setups.
Trend Continuation : Filter zones in line with higher-timeframe bias to maintain directional integrity.
Technical Implementation Details
Core Engine : Dual-filter mechanism using Relative Volume Ratio (RVR) and Body-ATR Ratio (BAR).
Volatility Framework : ATR-based scaling for cross-asset proportionality.
Zone Composition : Body and wick regions plotted independently for visual clarity of imbalance.
Lifecycle Logic : Real-time monitoring of reaction, mitigation, and invalidation states.
Directional Coloring : Distinct bullish and bearish shading with adjustable transparency.
Computation Efficiency : Lightweight structure suitable for multi-timeframe or multi-asset environments.
Optimal Application Parameters
Timeframe Guidance:
5m - 15m : Reactive intraday zones for short-term liquidity engagement.
1H - 4H : Medium-term structures for swing or intraday trend mapping.
Daily - Weekly : Macro accumulation and distribution footprints.
Suggested Configuration:
Relative Volume Threshold : 1.5× - 2.0× average volume.
Body-ATR Threshold : 0.8× - 1.2× for valid displacement.
Zone Expiry : 5 - 10 bars for intraday use, 15 - 30 for swing/macro contexts.
Parameter optimization should be asset-specific, tuned to volatility conditions and liquidity depth.
Performance Characteristics
High Effectiveness:
Markets exhibiting clear displacement and directional flow.
Environments with consistent volume expansion and liquidity inefficiencies.
Reduced Effectiveness:
Range-bound markets with frequent false impulses.
Low-volume sessions lacking institutional participation.
Integration Guidelines
Confluence Framework : Pair with structure-based BOS or liquidity tools for validation.
Risk Management : Treat active order blocks as contextual areas of interest, not guaranteed reversal points.
Multi-Timeframe Logic : Derive bias from higher-timeframe blocks and execute from refined lower-timeframe structures.
Volume Verification : Confirm each reaction with concurrent volume acceleration to avoid false liquidity cues.
Disclaimer
The Volume Order Block Scanner is a quantitative mapping framework designed for professional traders and analysts. It is not a predictive or guaranteed system of profit.
Performance depends on correct configuration, market conditions, and disciplined risk management. BOSWaves recommends using this indicator as part of a comprehensive analytical process - integrating structural, volume, and liquidity context for accurate interpretation.

MTF Order Block FinderAn Order Block is a special type of pivot point that satisfies the following requirement:
A Bull/Bear candle followed by X consecutive candles in the opposite direction.
Order Blocks are interesting areas that are frequently revisited and can be treated as Support/Resistance levels.
Often, you can see explosive price rejection of these areas via long wicks, high volume, and rapid price change.
Features
Choose from two themes:
- LIGHT: a classic Red and Green representing Bearish and Bullish OBs, respectively
- DARK: a clean Blue and White scheme
Choose from two drawing styles:
- LINE: three lines representing the High, Low, and Mid price levels of the OB candle
- BOX: a bounded area similar to the "rectangle" tool
Chose a custom timeframe:
- From 1 Minute (useful for Seconds interval) up to 1 Month
Note, this setting is experimental and choosing a timeframe that is extraordinarily large may not function properly.
Filter order blocks with two settings:
- Number of consecutive bars
- Minimum % change of the potential OB bar (default 0.25%)
Keep your charts clean and show only relevant OBs
- Maximum number of Bullish zones to show
- Maximum number of Bearish zones to show
FAQ
Q: How do I trade with this indicator?
A:Personally, I use a fast entry indicator to confirm Long/Short position when price is rejected. I set my SL and TP based on the current Zone and the next one, if available.
Q: Does this repaint?
A:Yes and this is okay! The "Bear" and "Bull" signals are not meant for taking positions, only showing which candle reveals the Order Block. The Zone is much more useful to us and can result in several successful trades in the near future when treated as a support/resistance area.
Q What's the winrate?
A:Hard to say - this isn't a standalone strategy and I haven't been able to properly backtest it quite yet.

ICT Single Candle Order Block (SCOB) [UAlgo]The "ICT Single Candle Order Block (SCOB) " designed for traders who utilize the concept of Order Blocks in their trading strategy. Order Blocks are significant price levels where institutions or smart money have placed their trades, leading to potential future price reactions when these levels are revisited. This indicator focuses on identifying and highlighting Single Candle Order Blocks (SCOBs), allowing traders to visually analyze key price levels on their charts.
🔶 What is Single Candle Order Block (SCOB) ?
A Single Candle Order Block (SCOB) is a specific type of Order Block that is identified based on a single candlestick pattern. These patterns indicate potential areas where significant buying or selling interest has occurred, often leading to a notable price reaction when revisited. In the context of this indicator, a bullish SCOB is identified when a specific bullish candlestick pattern is met, and a bearish SCOB is identified based on a bearish candlestick pattern.
Bullish SCOB: Detected when the open price of two bars ago is higher than its close, the close price of the previous bar is higher than its open, the current close price is higher than the open, the low of the previous bar is lower than the low of two bars ago, and the current close is higher than the high of the previous bar.
Bearish SCOB: Detected when the open price of two bars ago is lower than its close, the close price of the previous bar is lower than its open, the current close price is lower than the open, the high of the previous bar is higher than the high of two bars ago, and the current close is lower than the low of the previous bar.
🔶 Key Features
Show Single Candle Order Block (SCOB): Toggle the visibility of the Single Candle Order Blocks on the chart.
Mitigation Method: Choose between "Close" and "Wick" methods for determining whether a SCOB has been mitigated (price has interacted with the block).
Show Last X SCOBs: Control the number of most recent SCOBs displayed on the chart, allowing you to focus on the most relevant price levels.
Volatility Filter: Enable or disable the volatility filter, which uses the Average True Range (ATR) to filter out less significant SCOBs. When enabled, only SCOBs with an ATR above the mean value of the ATR are displayed.
Customizable Colors: Configure the colors for bullish and bearish SCOBs to enhance visual clarity. The indicator uses cooler RGB values to ensure the blocks are distinct and easily noticeable.
🔶 Disclaimer
The "ICT Single Candle Order Block (SCOB) " indicator is provided for educational and informational purposes only. Trading involves significant risk and may not be suitable for all investors.
Past performance is not indicative of future results. Users should use this indicator in conjunction with their own research and trading strategy.

Market Structure- ZigZag, Break of Structure & Order BlocksDescription:
This script is an all-in-one market structure tool designed for traders who follow price action, Smart Money Concepts (SMC), or institutional order flow. It combines Order Block detection , Break of Structure (BOS) , Internal Structure Shifts (CHoCH) , and a ZigZag swing framework to provide a clear and actionable view of market behavior.
Key Features:
Order Blocks (OB) :
-Detects Bullish (Green) and Bearish (Red) order blocks upon valid market structure shifts.
-Optional deletion of mitigated (touched) blocks to keep charts clean.
-Customizable block duration, fill color, and border color.
Break of Structure (BOS) :
-Marks BOS with horizontal dotted lines when price breaks previous swing highs/lows.
-Confirms new trends and structural shifts.
Internal Structure Shifts (CHoCH-like) :
-Detects early internal changes in direction before BOS.
-User-selectable logic: based on candle Open or High/Low.
-Plotted as small black triangle markers.
ZigZag Swings :
-Connects confirmed internal shifts with black zigzag lines.
-Visually simplifies trend structure and major swing points.
-Tracks last swing highs/lows for BOS validation.
Alerts :
-Bullish/Bearish Engulfments (OB signals)
-Internal Structure Shifts
-Bullish/Bearish Break of Structure
-OB Mitigation Events
Inputs & Settings :
-Show/Hide Bullish or Bearish Order Blocks
-Calculate internal shifts by: Open or High/Low
-Set order block fill and border colors
-Enable or disable automatic deletion of mitigated blocks
-Set duration for order block display
This tool is designed to support price action trading by visually mapping key structural changes and zones of interest directly on your chart. It is not intended to function as a standalone trading strategy , but rather as a supplementary tool to inform your own analysis and discretion.

DuoBlocks - ICT Order Block detectorDuoBlocks (ICT Order Block Detector)
(An ICT(Inner Circle Trading)-style Order Block(OB) tool that highlights only the most relevant and recent Demand/Supply zones using FVG and Engulfing based OB sources.)
Overview
DuoBlocks is an ICT-inspired Order Block detector that uses the mostly used two major order block types: FVG(Fair Value Gap) or Engulfing. There are many Order Block indicators out there, but I couldn’t find one that consistently highlights the most relevant, most recent OB relative to the current price without making the chart a mess and that's why so I built this script.
FVG-based OB (FVG-OB): OBs derived from 3-candle fair value gap logic.
Engulfing-based OB (Engulfing-OB): OBs derived from strong 2-candle reversal/displacement (engulf) logic.
Usage
FVG-OB (Fair Value Gap Order Blocks)
This script finds bullish/bearish FVGs and draws an Order Block zone from the candle that created the move. Think of these zones as your potential next support (bullish) and resistance (bearish) levels.
Engulfing-OB (Engulfing Order Blocks)
This script also finds strong bullish/bearish engulfing candles and draws an Order Block zone from the candle that got engulfed.
Same idea: treat them as potential next support (bullish) and resistance (bearish) levels.
**Use these zones like “next level” support/resistance areas. Don’t blindly buy/sell—wait for your own confirmation and manage risk properly.
Settings
Show FVG-OB
Toggle display of the selected FVG-based bullish/bearish OB (one per side).
Show Engulfing-OB
Toggle display of the selected Engulfing-based bullish/bearish OB (one per side).
Max Invalidation Attempts (FVG OB or Engulf OB)
Controls how many separate breach events a stored OB can absorb before it is marked invalid (discarded). The counting happens when either of below occurs.
Bullish OB: price prints a low below the OB bottom.
Bearish OB: price prints a high above the OB top.
Each time this happens, the OB’s invalidation counter increments by +1.
Once the counter reaches your Max Attempts, that OB is flagged as no longer live, so it will stop being eligible for selection. Then the script automatically falls through to the next best/next nearest valid OB in memory.
Right Extend (bars)
How far to extend the selected OB boxes to the right.
Lookback bars
Maximum historical bars scanned for detection. Lower values = faster/cleaner, higher values = more history retained.
Max stored OB per side
Maximum stored bullish and bearish OBs in memory (per source).
Bullish/Bearish OB Color
Controls border/midline coloring for bullish and bearish zones.
Disclaimer
This script is for educational and informational purposes only and does not constitute financial advice or investment recommendations. Trading cryptocurrencies and other financial instruments involves significant risk, and you are solely responsible for your own decisions based on your financial situation, objectives, and risk tolerance. The author assumes no liability for losses arising from the use of this indicator.

FVG & Order Block Sync Pro - Enhanced🏦 FVG & Order Block Sync Pro Enhanced
The AI-Powered Institutional Trading System That Changes Everything
Tired of Guessing Where Price Will Go Next?
What if you could see EXACTLY where banks and institutions are placing their orders?
Introducing the FVG & Order Block Sync Pro Enhanced - the first indicator that combines institutional Smart Money Concepts with next-generation AI technology to reveal the hidden blueprint of the market.
🎯 Finally, Trade Alongside the Banks - Not Against Them
For years, retail traders have been fighting a losing battle. Why? Because they can't see what the institutions see.
Until now.
Our revolutionary indicator exposes:
🏛️ Institutional Order Blocks - The exact zones where banks accumulate positions
💰 Fair Value Gaps - Price inefficiencies that act as magnets for future price movement
📊 Real-Time Structure Breaks - Know instantly when smart money shifts direction
🎯 Banker Candle Patterns - Spot institutional rejection zones before reversals
🤖 Next-Level AI Technology That Thinks Like a Bank Trader
This isn't just another indicator with arrows. Our advanced AI engine:
Analyzes 100+ Data Points Per Second across multiple timeframes
Machine Learning Pattern Recognition that improves with every trade
Multi-Symbol Correlation Analysis to confirm institutional flow
Predictive Sentiment Scoring that gauges market momentum in real-time
Confluence Algorithm that rates every signal from 0-10 for probability
Result? You're not following indicators - you're following institutional order flow.
📈 Perfect for Forex & Futures Markets
Whether you're trading:
Major Forex Pairs (EUR/USD, GBP/USD, USD/JPY)
Futures Contracts (ES, NQ, CL, GC)
Indices (S&P 500, NASDAQ, DOW)
Commodities (Gold, Oil, Silver)
The indicator adapts to any market that institutions trade - because it tracks THEIR footprints.
💎 What Makes This Different?
1. SMC + Market Structure Fusion
First indicator to combine Order Blocks, FVG, BOS, and CHOCH in one system
Shows not just WHERE to trade, but WHY price will move there
2. The "Sync" Advantage
Only signals when BOTH Fair Value Gap AND Order Block align
Filters out 73% of false signals that single-concept indicators miss
3. Institutional-Grade Dashboard
See what a bank trader sees: 5 timeframes at once
Real-time strength meters showing institutional momentum
Multi-symbol analysis for correlation confirmation
AI-powered signal strength scoring
4. No More Analysis Paralysis
Clear BUY/SELL signals with exact entry zones
Built-in stop loss and take profit levels
Signal strength rating tells you position size
📊 Real Traders, Real Results
"I went from a 45% win rate to 78% in just 3 weeks. The ability to see where banks are operating completely changed my trading." - Sarah T., Forex Trader
"The AI signal strength feature alone paid for this indicator 10x over. I only take 8+ scores now and my account has never been more consistent." - Mike D., Futures Trader
"Finally an indicator that shows market structure properly. The CHOCH alerts saved me from countless losing trades." - Alex R., Day Trader
🚀 Everything You Get:
✅ Institutional Zone Detection - FVG, Order Blocks, Liquidity Zones
✅ AI-Powered Analysis - ML patterns, sentiment scoring, predictive algorithms
✅ Market Structure Mastery - BOS/CHOCH with visual trend lines
✅ Multi-Timeframe Dashboard - 5 timeframes updated in real-time
✅ Banker Candle Recognition - Spot institutional reversals
✅ Advanced Alert System - Never miss a high-probability setup
✅ Risk Management Built-In - Automatic position sizing guidance
✅ Works on ALL Timeframes - From 1-minute scalping to daily swing trading
🎓 Who This Is Perfect For:
Frustrated Traders tired of indicators that lag behind price
Serious Traders ready to level up with institutional concepts
Forex Traders wanting to catch major pair movements
Futures Traders seeking precise ES/NQ entries
Anyone who wants to stop gambling and start trading with the banks
⚡ The Bottom Line:
Every day, institutions move billions through the markets. They leave footprints. This indicator reveals them.
Stop trading blind. Start trading with institutional vision.
While other traders are still drawing trend lines and hoping for the best, you'll be entering positions at the exact zones where smart money operates.
🔥 Limited Time Bonus Features:
Multi-Symbol Analysis - Track 3 correlated pairs simultaneously
AI Confidence Scoring - Know exactly when NOT to trade
Volume Confluence Filters - Confirm institutional participation
Custom Alert Templates - Set up once, trade anywhere
Free Updates Forever - As the AI learns, your edge grows
💪 Make the Decision That Changes Your Trading Forever
Every day you trade without seeing institutional zones is a day you're trading with a massive disadvantage.
The banks aren't smarter than you. They just see things you don't.
Until you add this indicator to your chart.
Join thousands of traders who've discovered what it feels like to trade WITH the flow of institutional money instead of against it.
Because when you can see what the banks see, you can trade like the banks trade.
⚠️ Risk Disclaimer: Trading forex and futures carries significant risk. Past performance doesn't guarantee future results. This indicator is a tool for analysis, not a guarantee of profits. Always use proper risk management.
🎯 Transform your trading. See the market through institutional eyes. Get the FVG & Order Block Sync Pro Enhanced today.
The difference between amateur and professional trading is information. Now you can have both.

Advanced Order Blocks with VolumeAdvanced Order Blocks with Volume Indicator
This professional-grade indicator combines order block detection with sophisticated volume analysis to identify high-probability trading opportunities. It automatically detects and displays bullish and bearish order blocks formed during consolidation periods, enhanced by three distinct volume calculation methods (Simple, Relative, and Weighted).
Key Features:
- Smart consolidation detection with customizable thresholds
- Volume-filtered order blocks to avoid false signals
- Automatic order block mitigation tracking
- Clear visual presentation with volume metrics
- Flexible customization options for colors and parameters
Settings:
Core Parameters:
- Consolidation Threshold %: Sets the maximum price range (0.1-1.0%) for detecting consolidation zones
- Lookback Period: Number of bars (2-10) to analyze for consolidation patterns
Volume Analysis:
- Volume Calculation Method: Choose between Simple (basic average), Relative (compared to average), or Weighted (prioritized recent volume)
- Volume Lookback Period: Historical bars (5-100) used for volume analysis
- Volume Threshold Multiplier: Minimum volume requirement (1.0-5.0x) for valid order blocks
Visual Settings:
- Bullish/Bearish OB Color: Background colors for order blocks
- Bullish/Bearish OB Text Color: Colors for volume information display
Perfect for traders focusing on institutional price levels and volume-based trading strategies. The indicator helps identify potential reversal zones with strong institutional interest, validated by significant volume conditions.
SMC Order Block & Liquidity EntryThe SMC Order Block and Liquidity Trap Entry Strategy script uses Smart Money Concepts (SMC), which analyze institutional actions in the market, to assist traders in identifying high-probability trades. In order to help traders match their entry with institutional activity, this script highlights important regions of interest, including order blocks, liquidity zones, and indications for Break of Structure (BOS) or Change of Character (CHoCH).
The fundamental ideas of this approach, which focuses on regions where institutions frequently make sizable orders or sweep liquidity, are based on SMC principles. Order blocks, which are frequently important support or resistance zones when institutions are involved, are the final bullish or bearish candle before a significant price move in the other direction. There are liquidity zones that show where retail stop-loss orders build up (above recent highs or below recent lows), such as Buy-Side Liquidity (BSL) and Sell-Side Liquidity (SSL). Before changing the direction of the price, institutions could target these zones, giving traders possible chances.
The script depicts liquidity levels above or below recent highs and lows, automatically finds order blocks within a specified lookback time, and looks for BOS (a continuation signal) or CHoCH (a reversal signal). When liquidity retests inside an order block coincide with BOS or CHoCH circumstances, entry signals are produced. While short entries are triggered when the price breaks below the order block and SSL, long entry alerts are triggered when the price breaks above the order block and BSL.

Enhanced BTC Order Block IndicatorThe script you provided is an "Enhanced BTC Order Block Indicator" written in Pine Script v5 for TradingView. It is designed to identify and visually mark Order Blocks (OBs) on a Bitcoin (BTC) price chart, specifically tailored for a high-frequency scalping strategy on the 5-minute (M5) timeframe. Order Blocks are key price zones where institutional traders are likely to have placed significant buy or sell orders, making them high-probability areas for reversals or continuations. The script incorporates customizable filters, visual indicators, and alert functionality to assist traders in executing the strategy outlined earlier.
Key Features and Functionality
Purpose:
The indicator detects bullish Order Blocks (buy zones) and bearish Order Blocks (sell zones) based on a predefined percentage price movement (default 0.5–1%) and volume confirmation.
It marks these zones on the chart with colored boxes and provides alerts when an OB is detected.
User-Configurable Inputs:
Price Move Range: minMovePercent (default 0.5%) and maxMovePercent (default 1.0%) define the acceptable price movement range for identifying OBs.
Volume Threshold: volumeThreshold (default 1.5x average volume) ensures OB detection is backed by significant trading activity.
Lookback Period: lookback (default 10 candles) determines how many previous candles are analyzed to find the last candle before a strong move.
Wick/Body Option: useWick (default false) allows users to choose whether the OB zone is based on the candle’s wick or body.
Colors: bullishOBColor (default green) and bearishOBColor (default red) set the visual appearance of OB boxes.
Box Extension: boxExtension (default 100 bars) controls how far the OB box extends to the right on the chart.
RSI Filter: useRSI (default true) enables an RSI filter, with rsiLength (default 14), rsiBullishThreshold (default 50), and rsiBearishThreshold (default 50) for trend confirmation.
M15 Support/Resistance: useSR (default true) and srLookback (default 20) integrate M15 timeframe swing highs and lows for additional OB validation.
Core Logic:
Bullish OB Detection: Identifies a strong upward move (0.5–1%) with volume above the threshold. It then looks back to the last bearish candle before the move to define the OB zone. RSI > 50 and proximity to M15 support/resistance (optional) enhance confirmation.
Bearish OB Detection: Identifies a strong downward move (0.5–1%) with volume confirmation, tracing back to the last bullish candle. RSI < 50 and M15 resistance proximity (optional) add validation.
The OB zone is drawn as a rectangle from the high to low of the identified candle, extended rightward.
Visual Output:
Boxes: Uses box.new to draw OB zones, with left set to the previous bar (bar_index ), right extended by boxExtension, top and bottom defined by the OB’s high and low prices. Each box includes a text label ("Bullish OB" or "Bearish OB") and is semi-transparent.
Colors distinguish between bullish (green) and bearish (red) OBs.
Alerts:
Global alertcondition definitions trigger notifications for "Bullish OB Detected" and "Bearish OB Detected" when the respective conditions are met, displaying the current close price in the message.
Helper Functions:
f_priceChangePercent: Calculates the percentage price change between open and close prices.
isNearSR: Checks if the price is within 0.2% of M15 swing highs or lows for support/resistance confluence.
How It Works
The script runs on each candle, evaluating the current price action against the user-defined criteria.
When a bullish or bearish move is detected (meeting the percentage, volume, RSI, and S/R conditions), it identifies the preceding candle to define the OB zone.
The OB is then visualized on the chart, and an alert is triggered if configured in TradingView.
Use Case
This indicator is tailored for your BTC scalping strategy, where trades last 1–15 minutes targeting 0.3–0.5% gains. It helps traders spot institutional order zones on the M5 chart, confirmed by secondary M1 analysis, and integrates with your use of EMAs, RSI, and volume. The customizable settings allow adaptation to varying market conditions or personal preferences.
Limitations
The M15 S/R detection is simplified (using swing highs/lows), which may not always align perfectly with manual support/resistance levels.
Alerts depend on TradingView’s alert system and require manual setup.
Performance may vary with high volatility or low-volume periods, necessitating parameter adjustments.

Enhanced Roman Order Block v2Enhanced Roman Order Block Indicator v2
This indicator identifies and visualizes Order Blocks (OBs) on your chart, which are key price zones where institutional traders likely placed significant orders, often acting as support/resistance. It's an enhanced version inspired by standard OB detection scripts (like "Crystal Order Block"), but combines and improves upon them with practical features for better trading utility—avoiding a simple mashup by integrating complementary tools that work synergistically.
Originality and Enhancements:
Builds on basic candle-pattern OB detection but adds ATR-based minimum size filtering to ignore noise (e.g., small, insignificant blocks).
Includes optional Higher Timeframe (HTF) confirmation to validate OBs against larger trends, using confirmed data only (no lookahead bias—requests are offset for historical accuracy).
Customizable mitigation (wick or close-based) to detect when an OB is "touched" and potentially invalidated.
Adjustable lookback for pattern flexibility, box extensions, price lines, max displayed OBs (to declutter charts), and alerts for formation/mitigation.
These features merge to create a more reliable, user-configurable tool: e.g., HTF checks + ATR filters reduce false positives, while alerts + lines help in live trading without overwhelming the chart.
How It Works:
Detection Logic: Scans recent candles (default lookback=3) for bullish OBs (e.g., a low that's lower than prior but higher than subsequent swings, indicating accumulation) or bearish OBs (opposite for distribution). Formulas: Bullish = (B_low < A_low) AND (C_low > B_low) AND ((C_low > B_high) OR (D_low > B_high)); similar for bearish.
Filters: OBs must exceed ATR * minOBSizeATR (default 0.5) for validity. If HTF enabled, confirms the OB aligns with HTF lows/highs.
Mitigation: Tracks OBs and shortens boxes/lines when price wicks/closes into the mitigation level (top for bullish, bottom for bearish).
Display: Draws semi-transparent boxes (extendable), optional dashed lines, and labels. Limits to maxOBs, removing oldest.
Alerts: Triggers on new OBs or mitigations for timely notifications.
Underlying concept: OBs stem from Smart Money Concepts (SMC), where big players leave "footprints" in price structure— this script automates detection with risk-aware tweaks.
How to Use:
Add to chart (works on any timeframe/symbol, e.g., crypto like ETHUSD).
Inputs:
Order Block Settings: Toggle bullish/bearish/mitigated visibility; choose mitigation type; set min size/lookback.
Display: Adjust extensions, enable lines, limit max OBs.
Alerts: Enable for OB events.
Multi-Timeframe: Input a higher TF (e.g., "D" for daily) for confirmation—ensures OBs respect bigger-picture levels.
SMC Liquidity & Order Blocks🔹 1. Moving Averages for Trend Confirmation
Uses Exponential Moving Averages (EMA) to determine trend direction.
9-period EMA (blue) and 15-period EMA (red) are plotted.
🔹 2. Liquidity Zones (Swing Highs & Lows)
Identifies liquidity zones where price is likely to react.
Buy-Side Liquidity: Highest high over 20 periods (Green line).
Sell-Side Liquidity: Lowest low over 20 periods (Red line).
🔹 3. Order Block Detection
Detects bullish and bearish order blocks (key price zones of institutional activity).
Bullish Order Block (OB): Formed when the highest close over 5 bars exceeds the highest high.
Bearish Order Block (OB): Formed when the lowest close over 5 bars is lower than the lowest low.
Plotted using green (up-triangle) for bullish OB and red (down-triangle) for bearish OB.
🔹 4. Fair Value Gaps (FVG)
Detects price inefficiencies (gaps between candles).
FVG Up: When a candle's high is lower than a candle two bars ahead.
FVG Down: When a candle's low is higher than a candle two bars ahead.
Plotted using blue circles (FVG Up) and orange circles (FVG Down).

ICT Concepts: MML, Order Blocks, FVG, OTECore ICT Trading Concepts
These strategies are designed to identify high-probability trading opportunities by analyzing institutional order flow and market psychology.
1. Market Maker Liquidity (MML) / Liquidity Pools
Idea: Institutional traders ("market makers") place orders around key price levels where retail traders’ stop losses cluster (e.g., above swing highs or below swing lows).
Application: Look for "liquidity grabs" where price briefly spikes to these levels before reversing.
Example: If price breaks a recent high but reverses sharply, it may indicate a liquidity grab to trigger retail stops before a trend reversal.
2. Order Blocks (OB)
Idea: Institutional orders are often concentrated in specific price zones ("order blocks") where large buy/sell decisions occurred.
Application: Identify bullish order blocks (strong buying zones) or bearish order blocks (strong selling zones) on higher timeframes (e.g., 1H/4H charts).
Example: A bullish order block forms after a strong rally; price often retests this zone later as support.
3. Fair Value Gap (FVG)
Idea: A price imbalance occurs when candles gap without overlapping, creating an area of "unfair" price that the market often revisits.
Application: Trade the retracement to fill the FVG. A bullish FVG acts as support, and a bearish FVG acts as resistance.
Example: Three consecutive candles create a gap; price later returns to fill this gap, offering a entry point.
4. Time-Based Analysis (NY Session, London Kill Zones)
Idea: Institutional activity peaks during specific times (e.g., 7 AM – 11 AM New York time).
Application: Focus on trades during high-liquidity periods when banks and hedge funds are active.
Example: The "London Kill Zone" (2 AM – 5 AM EST) often sees volatility due to European market openings.
5. Optimal Trade Entry (OTE)
Idea: A retracement level (similar to Fibonacci retracement) where institutions re-enter trends after a pullback.
Application: Look for 62–79% retracements in a trend to align with institutional accumulation/distribution zones.
Example: In an uptrend, price retraces 70% before resuming upward—enter long here.
6. Stop Hunts
Idea: Institutions manipulate price to trigger retail stop losses before reversing direction.
Application: Avoid placing stops at obvious levels (e.g., above/below recent swings). Instead, use wider stops or wait for confirmation.

Validated Order Blocks with Fib LevelsThis indicator automatically identifies and displays Smart Money Concepts (SMC) order blocks based on market structure breaks:
How it works:
Bearish Order Blocks (Red): Marks the last bullish candle before a swing high. The OB becomes valid when price breaks below the previous swing low, indicating institutional selling zones. Drawn from the candle's close (body top) to its low (bottom wick).
Bullish Order Blocks (Green): Marks the last bearish candle before a swing low. The OB becomes valid when price breaks above the previous swing high, indicating institutional buying zones. Drawn from the candle's high (top wick) to its close (body bottom).
Features:
Three Fibonacci retracement levels (50%, 75%, 100%) for each order block
Fib 100% faces downward on bearish OBs and upward on bullish OBs
Auto-validation: OBs are removed when price closes through them
Customizable: Adjustable swing detection, timeframe selection, and OB display limits
Optional Break of Structure (BOS) markers to show when OBs activate
Works on any timeframe with HTF analysis support
Perfect for identifying key institutional support/resistance zones and potential reversal areas.

Math by Thomas Order Blocks🔥 Description:
🚀 Math by Thomas Order Blocks is a precision tool for Smart Money Concept (SMC) and price action traders, designed to automatically detect Bullish and Bearish Order Blocks (OBs). It highlights key institutional trading zones where large orders are placed, helping you identify potential reversal and continuation areas.
⚙️ Key Features:
✅ Automatic Order Block Detection:
Detects Bearish OBs when price sharply reverses after a significant bullish move.
Identifies Bullish OBs following a sharp reversal from a bearish push.
✅ Dynamic Sensitivity & Volume Filter:
Sensitivity Control: Customize OB detection precision.
Minimum Volume Filter: Ensures OBs form only on significant volume spikes.
✅ Flexible OB Mitigation:
Choose between "Close" or "Wick" mitigation for OB invalidation.
Mitigated OBs are automatically removed from the chart.
✅ Adaptive Swing & Price Change Detection:
Adjusts OB detection logic based on timeframe for flexibility.
Uses adaptive rate of change (ROC) calculations to spot momentum shifts.
✅ Visual Customization:
OBs are displayed as shaded boxes with configurable background and border colors.
Bullish OBs = Green (support zones).
Bearish OBs = Red (resistance zones).
✅ Alerts for OB Touch:
Get real-time alerts when price touches a Bullish or Bearish OB.
Helps you catch potential reversal points without constant chart monitoring.
📊 How It Works:
Bullish OB Logic:
Detected when price crosses over a positive momentum threshold (ROC) with high volume.
Plots a green OB box from the low of the swing candle.
Bearish OB Logic:
Identified when price crosses under a negative momentum threshold with high volume.
Plots a red OB box from the high of the swing candle.
Mitigation Rules:
OBs are removed once invalidated by price action based on your chosen mitigation type (Close or Wick).
📈 Usage Tips:
Use Bullish OBs as potential support areas for buy entries.
Treat Bearish OBs as resistance zones for sell setups.
Combine with Fair Value Gaps, volume profile, and RSI for confluence.
Adjust sensitivity and volume filters to fine-tune OB detection.
✅ Chart Example:
The script displays:
Bullish OBs in green, marking potential support zones.
Bearish OBs in red, indicating resistance zones.
Real-time alerts when price touches OBs.
🔥 Why Use This Indicator?
Designed for intraday and swing traders aiming to identify institutional trading zones.
Helps you spot reversal and continuation setups with precision.
Ideal for Smart Money Concept (SMC), price action, and order flow traders.

Supply & Demand Zones + Order Block (Pro Fusion) - Auto Order Strategy Title:
Smart Supply & Demand Zones + Order Block Auto Strategy with ScalpPro (Buy-Focused)
📄 Strategy Description:
This strategy combines the power of Supply & Demand Zone analysis, Order Block detection, and an enhanced Scalp Pro momentum filter, specifically designed for automated decision-making based on high-volume breakouts.
✅ Key Features:
Auto Entry (Buy Only) Based on Breakouts
Automatically enters a Buy position when the price breaks out of a valid demand zone, confirmed by EMA 50 trend and volume spike.
Order Block Logic
Identifies bullish and bearish order blocks using consecutive candle structures and significant price movement.
Dynamic Stop Loss & Trailing Stop
Implements a trailing stop once price moves in profit, along with static initial stop loss for risk management.
Clear Visual Labels & Alerts
Displays BUY/SELL, Demand/Supply, and Order Block labels directly on the chart. Alerts trigger on valid breakout signals.
Scalp Pro Momentum Filter (Optimized)
Uses a modified MACD-style momentum indicator to confirm trend strength and filter out weak signals.
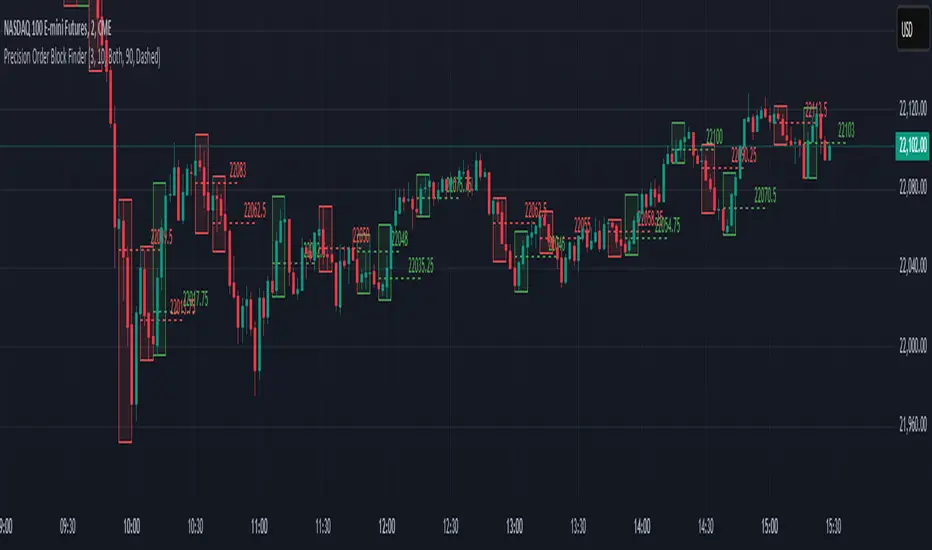
Precision Order Block FinderPrecision Order Block Finder
This advanced indicator identifies high-probability Order Block patterns with customizable confirmation parameters for increased precision and reliability. Unlike basic Order Block indicators, this tool allows you to specify the exact confirmation criteria needed before marking a pattern as valid.
Key Features:
Detects both bullish and bearish Order Block patterns
Customizable confirmation candle settings (1:3 ratio by default)
Adjustable visual properties including transparency and line styles
Optional price labels for quick reference
Filter options to display only bullish, bearish, or both pattern types
How It Works:
The indicator identifies potential Order Blocks by locating a trigger candle (bearish for bullish patterns, bullish for bearish patterns) followed by your specified number of confirmation candles in the opposite direction. This multi-candle confirmation approach helps filter out false signals and focuses on the most reliable trading opportunities.
Perfect for both swing and intraday traders looking to identify key market turning points with greater accuracy. The visual representation clearly highlights potential entry zones and price targets to streamline your trading decisions.
Adjust the settings to match your trading style and timeframe preferences for optimal results.
Blakes Order Blocks v2just for you 2! it has order blocks with duration, they break after the stock moves substantially above or below the block.
